Julio Espinoza

Data, Data, Data
When I'm not looking at data, you can find me hiking, learning more about personal finance, hiking, or finding a great food spot.
View My LinkedIn Profile
Massachusetts Education System May Be Doomed

Let’s Get Started!
Growing up, my parents knew the value of education and always encouraged us to pursue higher education. My parents have different educational backgrounds: my mother was the first in the family to go to college, while my father never made it past the 6th grade. It was very common that a child in a small town of a latin american country to start working at a young age to help support their family.
This got me interested in looking at an education case study. I was able to learn some key insights into Massaaachusetts school performance based on key performance indicators (KPI) that was requested by the superintendent.
Key Insights
After my analysis, I learned that:
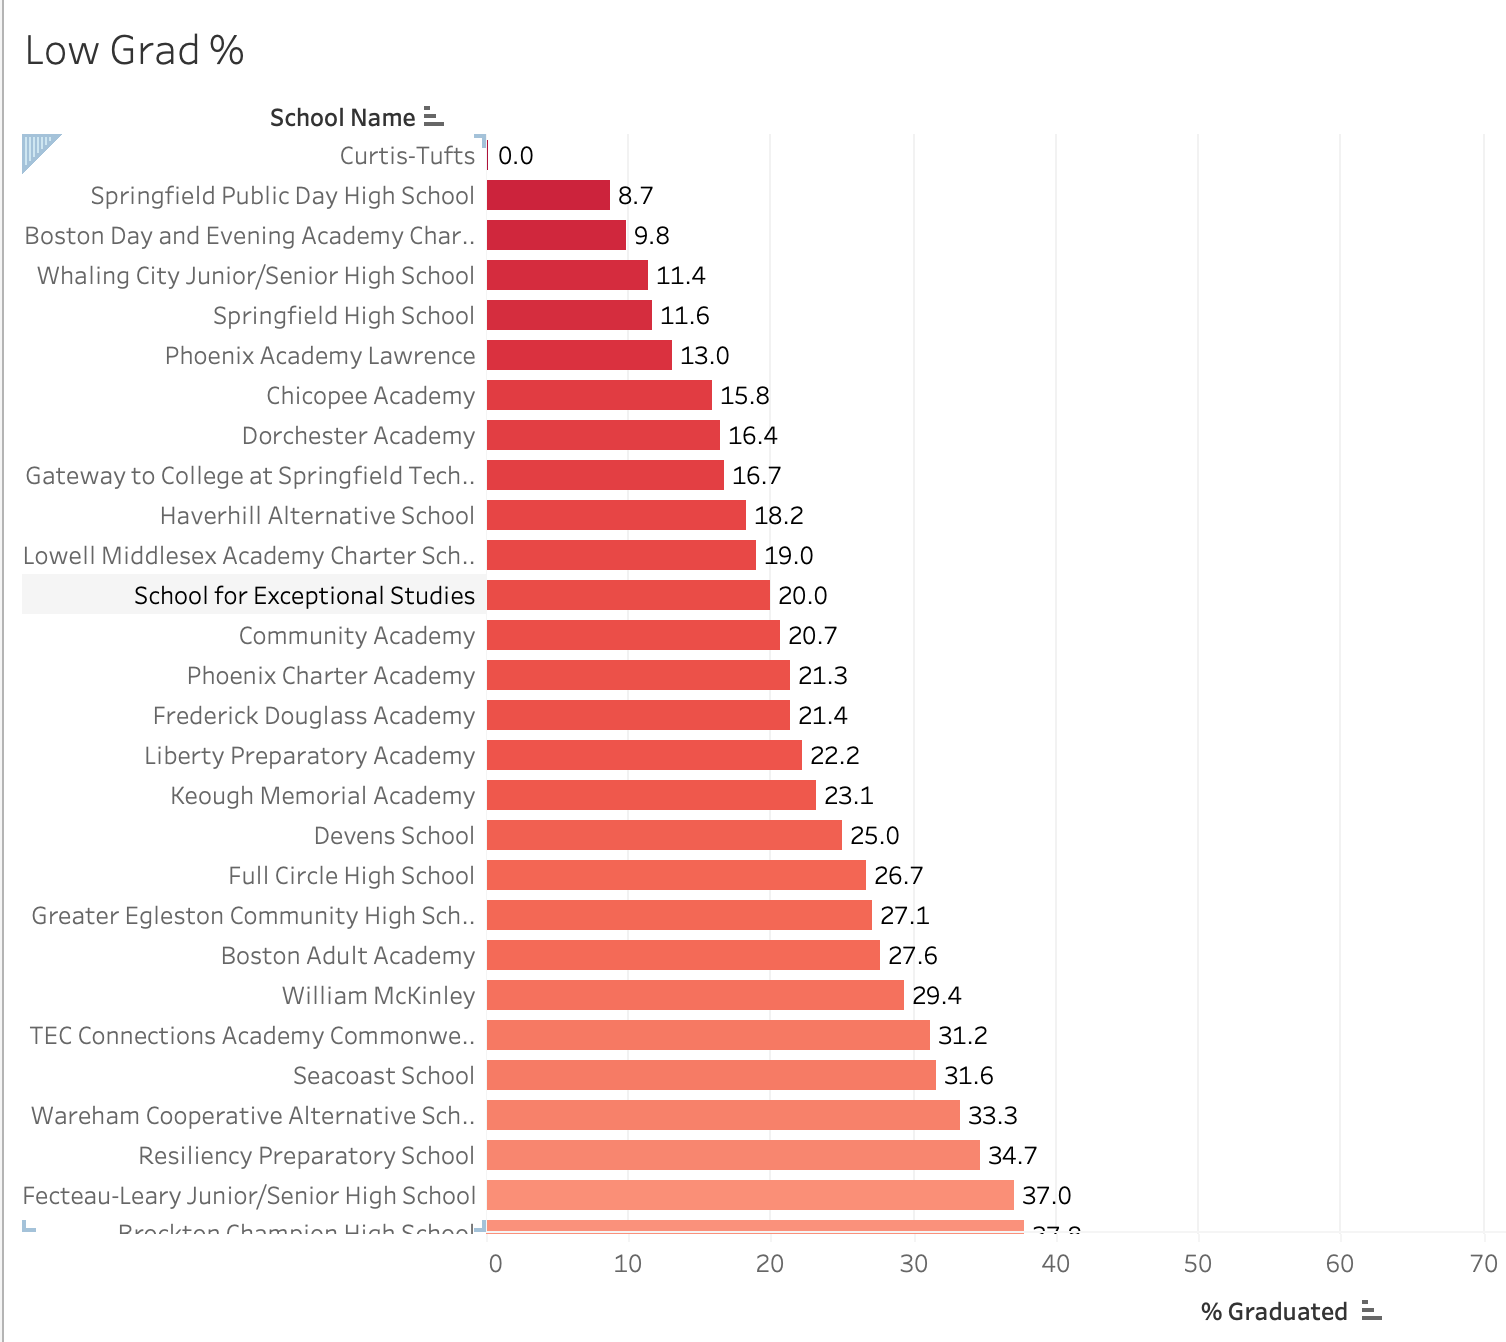
- The bottom 10 schools with the lowest graduation rates range from 0-18.2%.
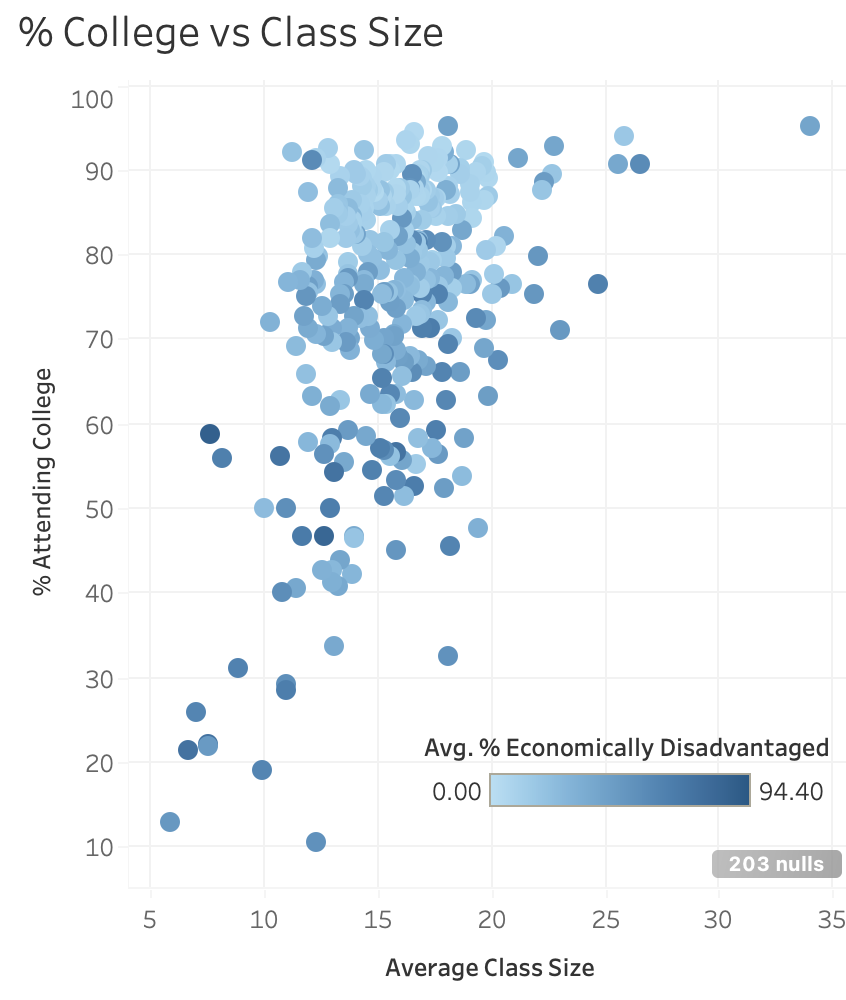
- Class sizes between 12-20 students have higher college attendance.
- Students that are economically disadvantaged have lower college attendance rates.
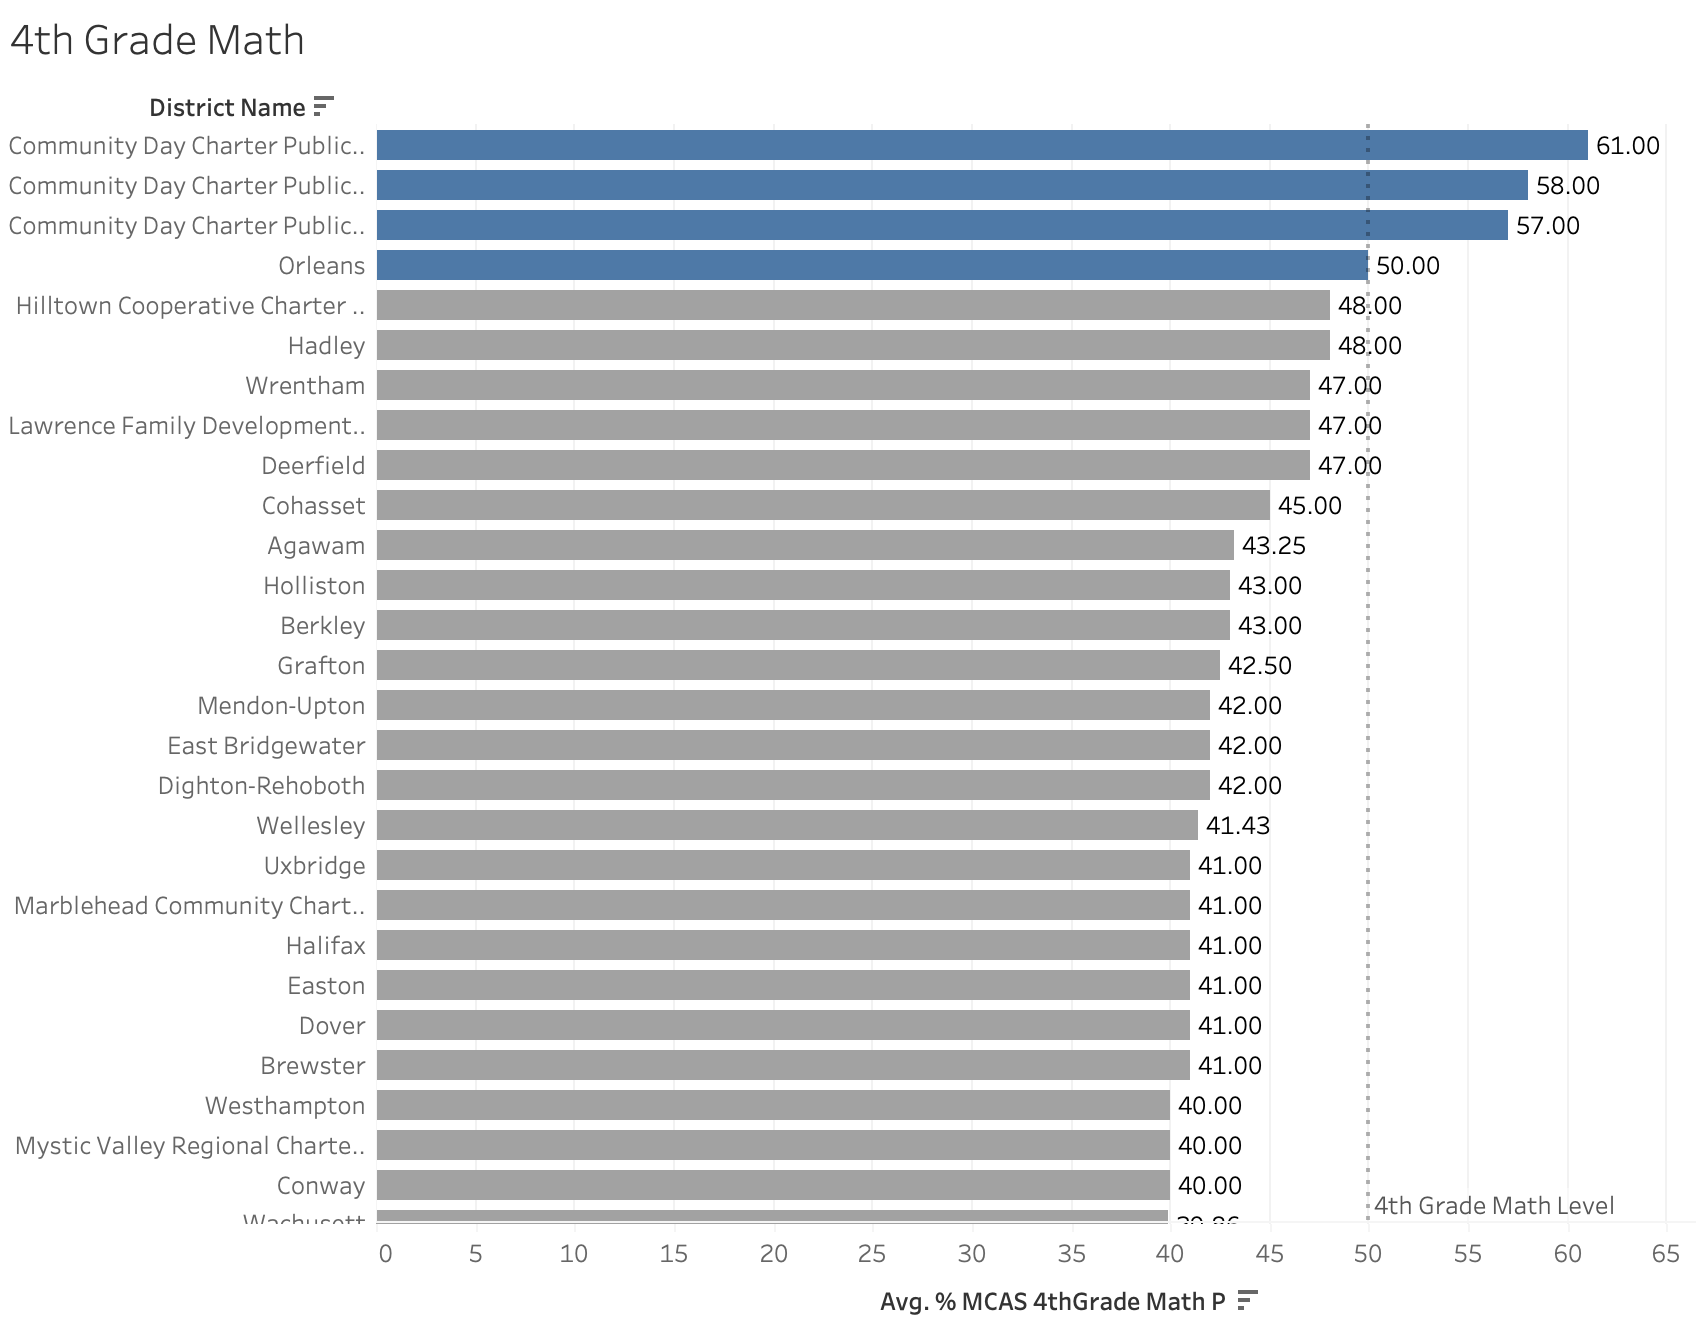
- 4 Schools are at or above the 50% passing threshold in mathematics.
The Data
The dataset was provided as an Excel (MA_Schools.xlsx) file and consists of 1861 rows and connected to Tableau for analysis. (Feel free to click the link to get redirected to my Tableau Dashboard)
The Analysis
I first looked at the lowest graduation rates to determine which schools in Massachusetts were struggling the most. We see below that the bottom 10 graudation rates range from 0-18.2%.
The next KPI was class size and its affect on college attendance. The data was analyzed by creating a scatter plot to show the relationship between class size and student attendance. We see that a 12-20 student class size range provides the highest concentration of students attending college and there does not appear to be significant attendance if class sizes were outside of this range.
Within the same scatter plot, college attendace for students that are economically disadvantaged was observed. We see that those that are less econmically diadvantaged have a higher rate of attending college.
The last KPI that was was observed was the students 4th grade math scores. The superintendent believes that 4th grade math is key to a students future success and would like to improve the states 4th grade math scores. I created a bar graph to show the average % of 4th grade math scores with a passing threshold of 50% or higher. We see that there are only 4 districts that meet or exceed that threshold. These schools are:
- Community Day Charter Public School-R. Kingman Webster
- Community Day Charter Public School-Prospect
- Community Day Charter Public School-Gateway
- Orleans
Results and Recommendation
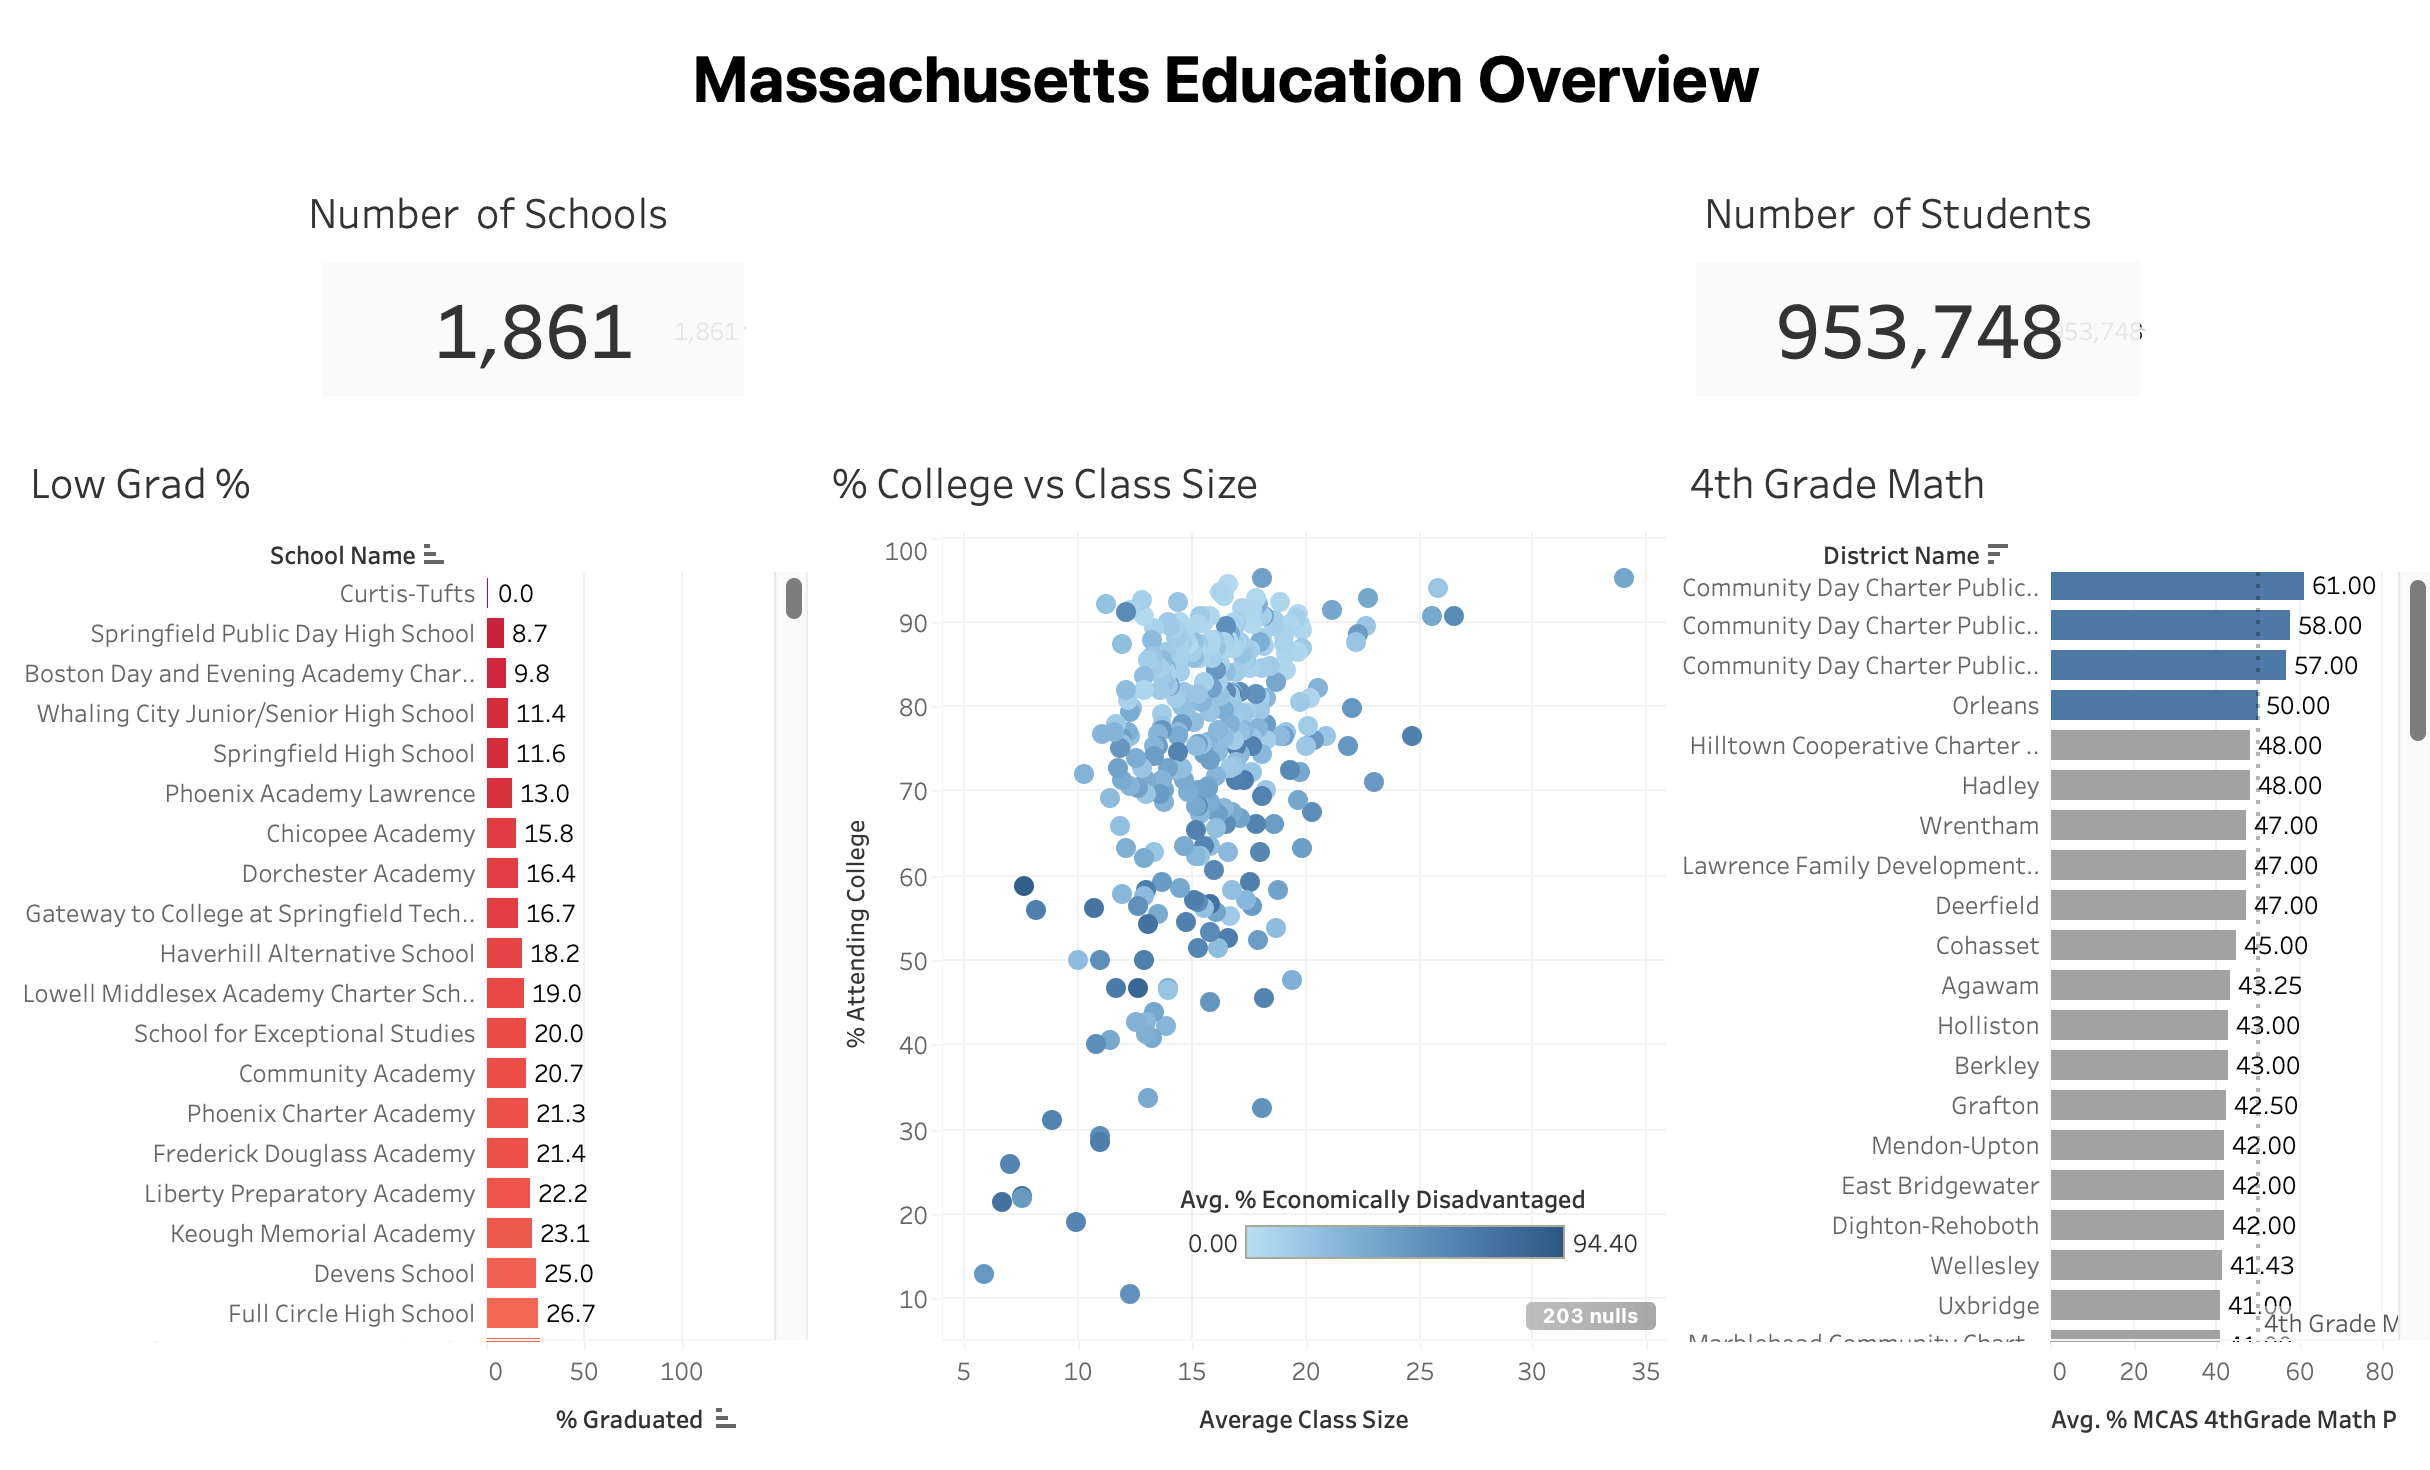
Different KPI’s for Massachusetts schools were observed to see how they affect college attendance. There is a total of 1,861 schools and a total of 953,748 students throughout the state of Massachusetts. Graduation rates were observed and found that the lowest 10 schools had graduation rates of 0-18.2%. Next we found that class sizes between 12-20 students have the highest concentration of students attending college and those that are more economically disadvantaged are less likely to attend college. Finally, we found 4 districts that meet or exceed the passing threshold for 4th grade math.
It is recommended thata class sizes should remain within the range of 12-20 students as there is no major improvement for college attendance if outside of that range. It is also recommended that the teachers in districts with passing math scores be invited to train the rest of the schools to improve math scores. Further analysis should be made to determine other contributing factors for low graduation rates. After further analysis, a decision can be made to improve graduation rates for the schools.
I appreciate you making it to the end of the article. Feel free to connect with me on LinkedIn.